- Feature Name: dashboard_backend
- Start Date: 2026-02-02
- Last Updated: 2026-02-17
- RFC PR: metalbear-co/rfcs#8
- RFC reference:
Summary
Deploy the Admin Dashboard as an in-cluster service alongside the mirrord operator. Usage data is stored in a SQLite database inside the license-server, which exposes it over an internal cluster HTTP API. The dashboard frontend is served through a Kubernetes ingress on the customer’s own domain.
Motivation
Enterprise customers need visibility into mirrord usage across their organization. Currently:
- No centralized dashboard - Usage data exists in the operator but isn’t easily accessible to admins
- Customer demand - Customers are asking for UI visibility into user activity
- Adoption tracking - Cost controllers need to justify mirrord investment with concrete usage metrics
- Current workaround - Users are directed to DataDog dashboards, which requires additional setup
Use Cases
- IT Admin wants to see how many developers are actively using mirrord this month
- Cost Controller wants to calculate time saved to justify license renewal
- Team Lead wants to identify power users for internal champions program
- Security Team wants to audit which users accessed the cluster via mirrord
Guide-level explanation
The Admin Dashboard is deployed inside the customer’s Kubernetes cluster as part of the mirrord operator Helm chart. Admins access it through a configured ingress (e.g., mirrord-dashboard.company.com).
Deployment
helm upgrade mirrord-operator metalbear/mirrord-operator \
  --set dashboard.enabled=true \
  --set dashboard.ingress.enabled=true \
  --set dashboard.ingress.host=mirrord-dashboard.company.com
All-Time Metrics Section
Cluster & Version Info:
- Connected cluster name - Shows which Kubernetes cluster the admin is currently viewing
- Operator version - Shows the installed mirrord operator version and helm chart version
- Tier - Deferred from initial release (always Enterprise for now). Will be added when the dashboard ships to other tiers
- Check for updates button - Redirects the admin to the charts CHANGELOG in a new tab
Usage Metrics:
- Developer time saved - Total developer time saved from mirrord sessions since adoption, as calculated in the ROI calculator
- CI waiting time saved - Total CI waiting time saved by mirrord, as calculated in the ROI calculator
- Licenses used / acquired - Seat usage vs. total available licenses
- Active user sessions - Number of currently active user sessions
- Active CI sessions - Number of currently active CI sessions
- “Learn more about CI” link - Help link for CI usage (hidden on Teams tier), opens CI docs in a new tab
- Max user concurrency - Peak concurrent user sessions since mirrord adoption
- Max CI concurrency - Peak concurrent CI sessions since mirrord adoption
- Total session time - Total time spent across all sessions, shown in human-readable form (years, months, weeks)
Adjust Calculation (ROI Calculator):
- Entry point to configure how time-saved values are calculated, opens a modal with:
- Number of all user sessions since adoption (display rounded up: tens up to 100, hundreds above 100, e.g. “1.1K sessions”)
- Input for estimated time saved per user session (default: 15 min, no negative values)
- Number of all CI sessions since adoption (same rounding rules as user sessions)
- Input for estimated time saved per CI session (default: 15 min, no negative values)
- Preview of the calculated total time saved in hours
Timeframe Data Section
- Date range picker (default: current month)
- Refresh button for real-time updates
Usage Analytics Section
- Bar chart of top active users
- Pie chart of user activity distribution
- Toggle between session time vs session count
User Activity Table
- Paginated list (20 users/page)
- Columns: Machine ID, Active Since, Last Session, Total Time, Sessions, Avg Duration
API Endpoints
The license-server exposes dashboard data over internal cluster HTTP. No additional authentication is needed between dashboard and license-server — both services run in the same namespace, and access control is handled at the ingress/port-forward level via K8s RBAC. The dashboard nginx proxy injects the x-license-key header for backend authentication.
GET /api/v1/reports/usage?format=json&from=<datetime>&to=<datetime>
  Response: UsageReportJson
The ?format=json parameter was added to the existing usage report endpoint (which already supports debug and xlsx formats), avoiding a new route.
Reference-level explanation
Architecture
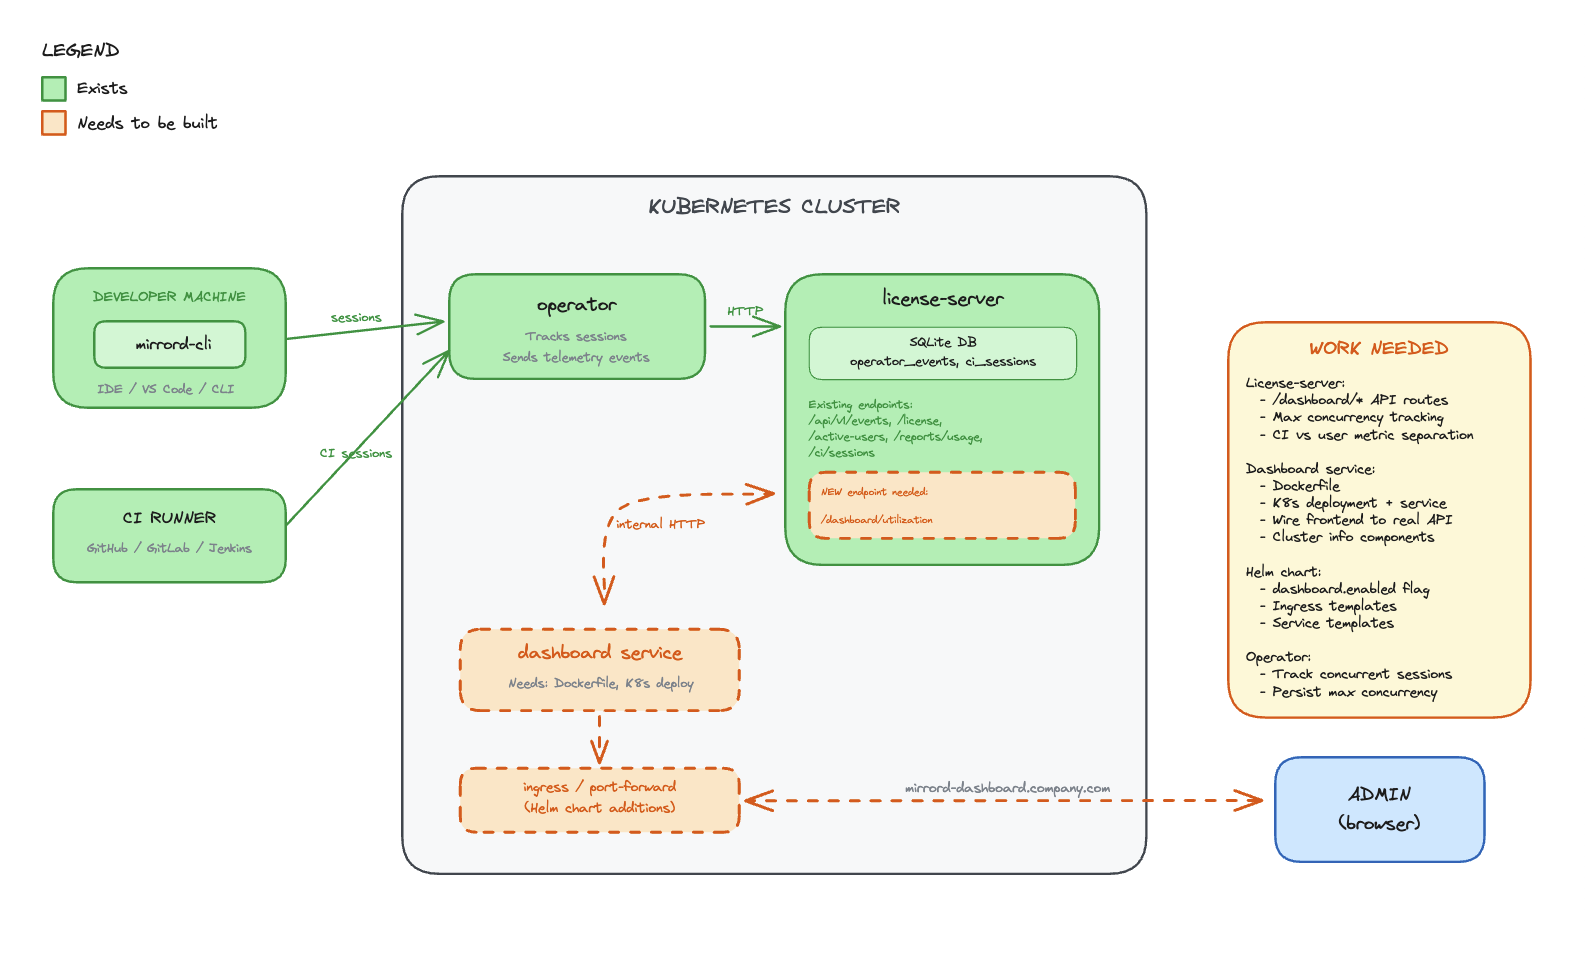
Components
License-server (SQLite DB)
- Stores all usage metrics, session history, and license data in SQLite (PostgreSQL migration planned for a future iteration — see Future possibilities)
- Receives data from the operator over an air-gapped internal connection
- Exposes a REST API over internal cluster HTTP for the dashboard to consume
Dashboard (React frontend)
- Lives in the operator repo, deployed as a container in the cluster
- Served through a Kubernetes ingress on the customer’s domain
- Calls the license-server API to fetch usage data
- No external dependencies - all data stays in the cluster
Operator
- Connects to the license-server via air-gapped channel
- Sends session and usage data to the license-server for persistence
Data Flow
- Operator tracks mirrord sessions and reports data to license-server (air-gapped)
- License-server persists usage data in SQLite
- Dashboard frontend calls license-server API over internal cluster HTTP
- License-server returns usage metrics from SQLite
- Dashboard renders metrics in the browser
Existing Operator Endpoints
Active Users (license.rs):
pub struct ApiActiveUser {
    user_license_hash: String,
    kubernetes_username: Option<String>,
    client_hostname: Option<String>,
    client_username: Option<String>,
    last_seen: Option<DateTime<Utc>>,
}
Usage Reports (reports.rs):
pub struct RecordClientCertificate {
    pub machine_id: String,
    pub first_active: Option<String>,
    pub last_seen: Option<String>,
    pub total_session_time_in_days: Option<f64>,
    pub total_session_count: Option<i64>,
    pub average_session_duration_in_days: Option<f64>,
    pub average_daily_sessions: Option<f64>,
}
Frontend Data Model
All API response fields use camelCase serialization via #[serde(rename_all = "camelCase")].
interface UsageReportJson {
  generalMetrics: {
    totalLicenses: number | null;
    tier: string;
    activeUsers: number;
    reportPeriod: { from: string; to: string };
    operatorVersion: string | null;
    lastOperatorEvent: string | null;
  };
  allTimeMetrics: {
    totalSessionCount: number;
    totalSessionTimeSeconds: number;
    totalCiSessionCount: number;
  };
  ciMetrics: {
    currentRunningSessions: number;
    maxConcurrentCiSessions: number;
    totalCiSessions: number;
    avgCiSessionDurationSeconds: number | null;
  };
  userMetrics: UserMetric[];
}
All-time metrics are separated into their own field to avoid mixing range-scoped and lifetime data.
Implementation Status
The backend and frontend are implemented across two PRs:
- operator#1261 — Adds
?format=jsonto the existing usage report endpoint,UsageReportJsonresponse type, all-time metrics, CI metrics separation, error handling with proper status codes - operator#1262 — Dashboard React frontend with nginx reverse proxy to license-server
Files Created/Modified
operator/dashboard/ (new):
- React app with nginx reverse proxy configuration
nginx.conf.template— proxies/api/to license-server, injectsx-license-keyheader- Dockerfile for the dashboard container
license-server:
state/reports.rs—get_usage_report_json()query with all-time metrics, CI separation, user metricserror.rs— JSON error responses with proper HTTP status codes andstd::error::Reportformatting
metalbear-api:
types/src/dashboard.rs—UsageReportJson,GeneralMetrics,AllTimeMetrics,CiMetrics,UserMetrictypestypes/src/lib.rs—ApiUsageReportFormatextended withJsonvariantroutes/reports.rs— JSON format match arm in usage report handler
Drawbacks
- Customer infrastructure - Dashboard runs on customer’s cluster resources
- Multi-cluster depends on shared license server - Cross-cluster aggregation works when operators share a license server instance, but customers who run separate license servers per cluster won’t get a unified view
- Ingress setup - Requires customer to configure ingress and DNS
- Data locality - Usage data stays in the cluster, MetalBear cannot access it for support
- Enterprise-only - Creates feature disparity between tiers
Rationale and alternatives
Why in-cluster with SQLite?
Chosen: Dashboard in the operator repo, SQLite in license-server, served via ingress
- Data stays in the customer’s cluster (privacy, compliance)
- No dependency on MetalBear cloud for dashboard functionality
- Works in air-gapped environments
- SQLite is simple, zero-config, and sufficient for the initial iteration
- License-server already exists and has the trust relationship with the operator
- PostgreSQL migration is planned for a future iteration to support admin-managed backup policies and better scalability
Alternatives Considered
Alternative A: Backend in app.metalbear.co (previous RFC)
- Pros: Multi-cluster aggregation, existing Frontegg auth
- Cons: Data leaves the cluster, depends on MetalBear cloud availability, network latency
- Rejected: CEO decision to keep data in-cluster
Impact of not doing this
- Customers continue relying on DataDog/Grafana setup (friction)
- No native visibility into mirrord usage
- Harder to justify ROI for license renewals
Prior art
DataDog Dashboard (current workaround)
- Operator exports Prometheus metrics that DataDog can scrape
- Requires customer to have DataDog and configure the integration
- Works but adds friction for customers without existing DataDog setup
Resolved questions
- Historical data retention - Data is retained for 5 years. In the future, users will be able to configure retention since the data lives on their infrastructure (per @liron-sel).
- Time saved calculation - ROI calculator stays as-is. Users set their own estimated time-saved-per-session values (per @gememma, @liron-sel).
- Subscription tier display - Dropped from initial release since all dashboard customers are Enterprise. Will be added when the dashboard ships to other tiers (per @liron-sel).
- Multi-cluster aggregation - The license server is intended to be shared across operators in multiple clusters, so the dashboard already provides cross-cluster aggregation by default. Customers can also choose one license server per cluster if they prefer (confirmed by @aviramha, @Razz4780).
- Auth between dashboard and license-server - No additional auth needed. Both services run in the same namespace, access control is at ingress level (confirmed by @Razz4780).
- Data backup - Deferred to PostgreSQL migration. Admins will manage their own backup policies (per @aviramha).
Unresolved questions
- Ingress TLS - Should we provide cert-manager integration out of the box?
- RBAC - Should dashboard access be gated by Kubernetes RBAC beyond port-forward/ingress access?
Future possibilities
- PostgreSQL migration - Migrate from SQLite to PostgreSQL to support admin-managed backup/disaster recovery policies and better scalability at high session volumes (per @aviramha’s recommendation)
- Multi-cluster view - For customers running separate license servers per cluster, provide a unified view that aggregates across instances
- IDE Integration - Launch dashboard from VS Code/IntelliJ extension
- Alerts - Notify admins when license utilization exceeds threshold
- Cost attribution - Break down usage by team/department
- Trend analysis - Week-over-week, month-over-month comparisons
- Custom reports - Scheduled email reports to stakeholders
- API access - Allow customers to query usage data programmatically